Mijares Group Analytics
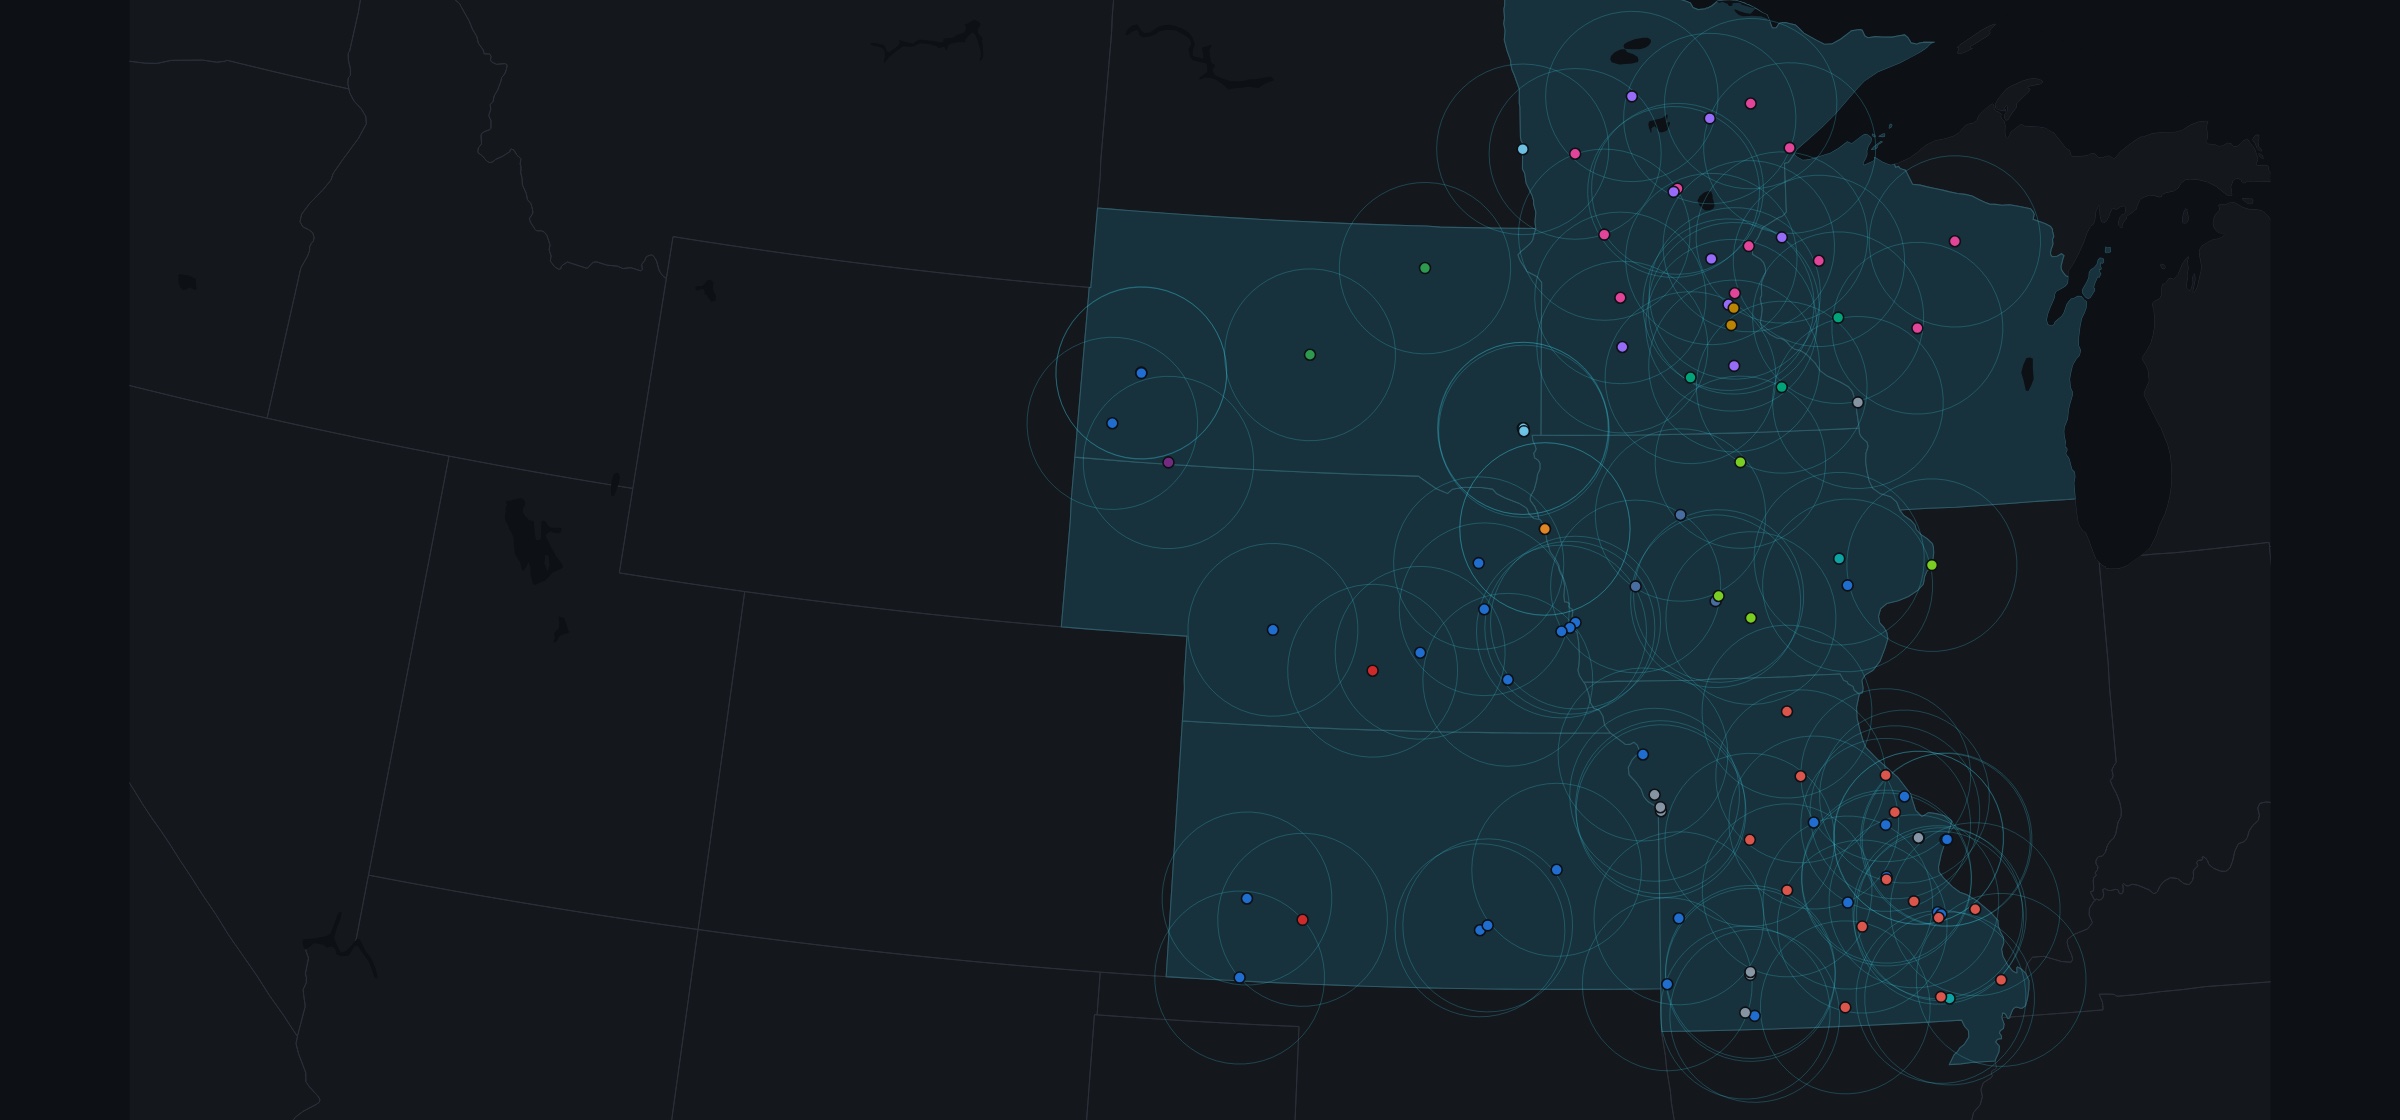
Coverage, competitive position and transport economics for air medical programs, built from public federal and state data. 104 bases mapped across seven states. 565 counties scored for demand, payer environment and access.
Where it stands
Model validation
1.6%
Gap between our break-even estimate and an independently published actuarial model, on separate data by a separate method. 187 vs 184 transports per year · Lieberthal et al., 2026
Network
104
Air medical bases located and attributed to operator across Minnesota, Missouri, Iowa, South Dakota, Nebraska, Kansas and Wisconsin. Federal provider registry, geocoded and classified
Analysis area
565
Counties scored for demand, insurance mix and distance to definitive care, with every input traceable to its source file. Census, CMS and state registry data
How we help
Services
The tool, so a leadership team can explore its own market directly. Or the analysis, delivered as a decision document with the working shown.
An interactive coverage and siting tool. Operator networks, hospital and airport candidate sites, county demographics and payer environment, response rings by airframe and headwind, and a competitive capture read on any candidate site.
Access is restricted. A password is required.
A written assessment of a defined market: who flies there now, what the demand and payer environment actually support, what volume a new base needs to clear its fixed cost, and the probability it gets there.
Our process
01
Locate and attribute every base in the market from the federal provider registry, then score each county for demand, payer mix and access. This is the step most analyses skip, and it is where competitive headroom is won or lost.
02
Establish the fixed cost of a base from measured industry data rather than assumption, then derive the transport volume required to clear it under the market's actual insurance mix.
03
Separate the findings that survived validation from the ones that did not, and say which is which. A clear negative is a usable answer. A confident guess is not.
What we do not claim
Our break-even engine validates externally and we stand behind it. Our ranking of candidate sites does not. Five separate tests put it indistinguishable from chance, the strongest at p = 0.86, and we report that rather than bury it.
That limit is not unique to us. Across four structured literature searches we found no published air medical siting model, on any continent, that has been validated against realised transport volume after a base actually opened. Anyone presenting a ranked list of sites as a proven method is presenting something the published record does not support.
So the work leads with what can be shown: what the market already covers, what a base there would cost, what volume it needs, and how likely that volume is. That is a narrower claim and a more useful one.